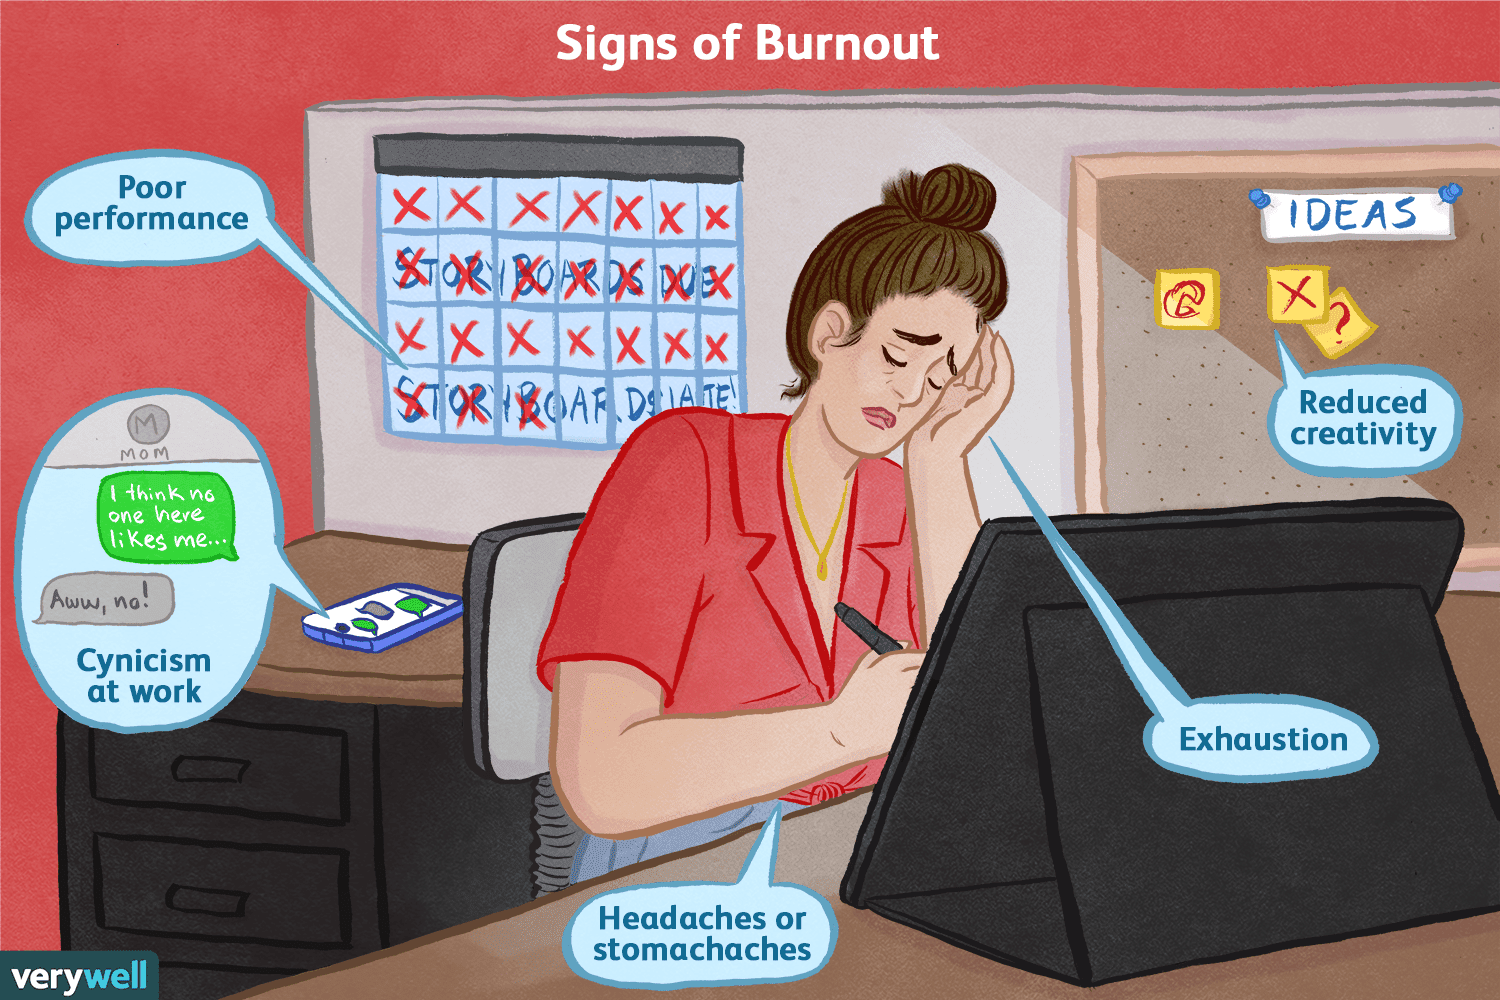
The Psychology of Burnout
We are the most connected generation right now, we have a realm of knowledge at...
Read More
Statistics Unpacked: Categorical Data in Action
Data is everywhere, shaping our daily decisions in ways we often overlook. From choosing a...
Read More
Sulfhemoglobinemia
Imagine waking up in the morning to find that your skin has a bluish tinge...
Read More